
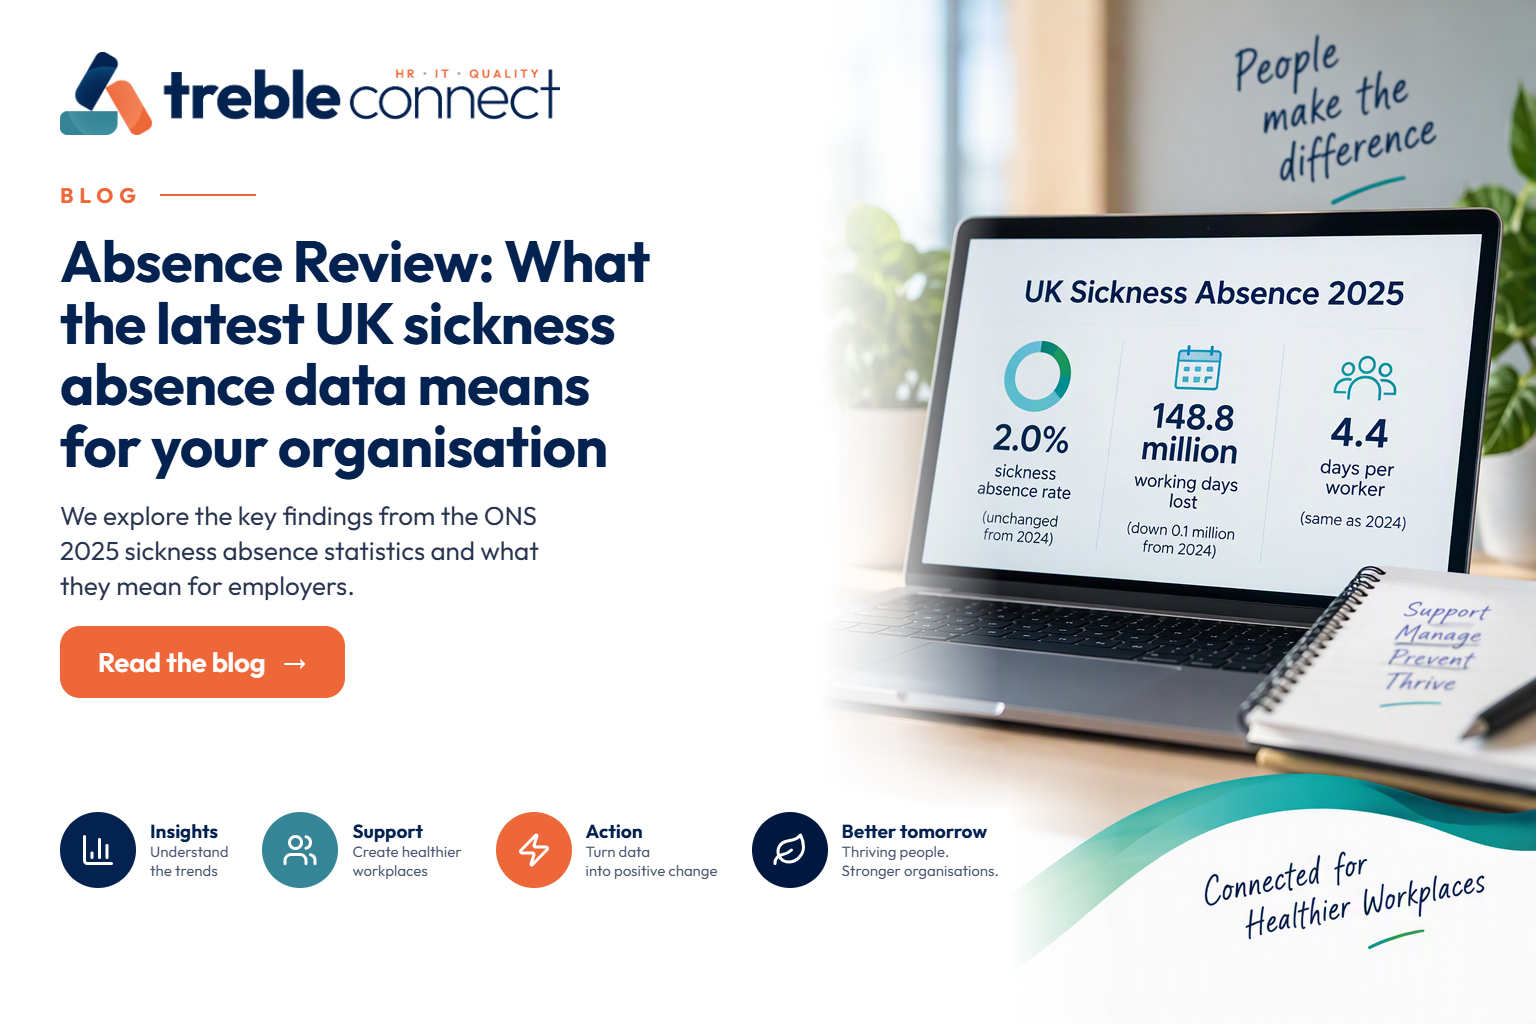
UK sickness absence in 2025: what the latest ONS figures mean for employers
The UK sickness absence rate held at 2.0% in 2025, with 148.8 million working days lost. What the latest ONS figures mean for UK employers, and how to benchmark and manage absence.
Absence held steady last year, but it is still above where it was before the pandemic. Here is what the numbers show, and how to use them to manage absence in your own business.
At a glance
- 0% sickness absence rate
- 8 million working days lost
- 4 days lost per worker
- 8 million more days lost than in 2019
Key takeaways
- The UK sickness absence rate stayed at 2.0% in 2025, with 4.4 days lost per worker, the same as 2024.
- Absence is still 9.8 million days a year above the 2019 level.
- Minor illnesses cause the most absences, but long mental health and musculoskeletal absences have the bigger impact on a business.
- Use the national figures as a benchmark for your business. Look at how often people are off and for how long, and keep long-term absence separate from short-term.
The headline: no change, but no recovery either
The Office for National Statistics published its 2025 sickness absence figures on 1 May 2026. The UK sickness absence rate, which is the share of working hours lost to sickness or injury, stayed at 2.0%. An estimated 148.8 million working days were lost, compared with 148.9 million in 2024. That is an average of 4.4 days per worker, also unchanged.
Absence has fallen since the post-pandemic peak, but it has not returned to normal. In 2025, 9.8 million more working days were lost than in 2019. For most employers, that means absence is a running cost to plan for, not something to deal with only when it comes up.
Why people are off work
Minor illnesses were the most common reason for absence, at almost a third of all occurrences.
- Minor illnesses: 30.4%
- Other conditions: 15.6%
- Musculoskeletal problems: 14.6%
- Mental health conditions: 8.9%
- Gastrointestinal problems: 6.6%
These figures count occurrences, not days lost. A single mental health or musculoskeletal absence can last weeks or months, so these conditions often cost a business far more than their share suggests.
Who is most likely to be absent
Absence is not spread evenly. The biggest gap is for workers with long-term health conditions, whose rate is four times higher than for those without.
- Workers with a long-term health condition: 4.0% (1.0% without)
- Workers aged 65 and over: 3.3% (1.3% aged 16–24)
- Process, plant and machine operatives: 3.3% (1.0% managers)
- Public sector employees: 2.9% (1.7% private sector)
- Part-time workers: 2.8% (1.9% full-time)
- Women: 2.4% (1.7% men)
There were regional differences too. Yorkshire and The Humber had the highest rate at 2.4%. London had the lowest at 1.5%, followed by the West Midlands at 1.8%. Wales saw the largest fall, down 0.4 percentage points.
What employers should do next
With absence holding above pre-pandemic levels, these are the steps we recommend to the businesses we support.
1. Monitor your own attendance trends
Review absence data regularly by department, location, role, working pattern and employee group. If your workforce includes groups that have higher absence nationally, check whether the same pattern shows up in your data. That will tell you where support and resources will make the most difference.
2. Invest in employee wellbeing
Nearly 149 million working days were lost across the UK in a single year, so wellbeing deserves a place on the business agenda. Practical options include an Employee Assistance Programme, mental health support, access to occupational health, health awareness campaigns and regular wellbeing check-ins.
3. Strengthen your absence management process
Consistent reporting procedures, return-to-work interviews and attendance reviews help you manage absence fairly. They also make sure employees get the right support when they need it.
4. Support employees with long-term health conditions
This group has the highest absence rate of any in the data. Reasonable adjustments, flexible working, phased returns and occupational health referrals can help people stay in work, which benefits both the employee and the business.
5. Equip your managers
Line managers usually handle absence day to day. Training them to recognise early signs of health concerns, hold sensitive attendance conversations and apply policy consistently builds a more supportive culture and cuts avoidable absence.
6. Take a preventative approach
Managing absence well means preventing it as well as reacting to it. Good leadership, employee engagement, sensible workloads, sound health and safety practice and wellbeing initiatives all reduce absence before it starts.
How to benchmark your absence
The UK average of 4.4 days lost per worker is a useful starting point for assessing your own attendance. When you compare:
- Use the 2.0% UK rate and the 1.7% private-sector rate as broad external benchmarks.
- Separate short-term and long-term absence, so frequent minor illness doesn’t hide serious conditions that need support and reasonable adjustments.
- Track both how often people are absent and how long each absence lasts.
- If you are a small employer, remember that one long-term absence can distort your percentage. Look at individual circumstances alongside the impact on the business.
- Record disability-related absence separately where appropriate, and consider reasonable adjustments before moving to formal capability action.
- Consider whether the Bradford Factor is right for your organisation.
Want to see how your absence levels compare?
We can review your absence data against these benchmarks, update your attendance policy, and train your managers to hold return-to-work and long-term absence conversations.
Contact our HR team at support@trebleltd.co.uk
About the data: the estimates cover people aged 16 and over in employment across the UK, based on annual averages from the Labour Force Survey. The ONS classifies the figures as official statistics in development, and advises extra caution when interpreting changes involving 2023 and 2024. Source: Office for National Statistics, Sickness absence in the UK labour market: 2025, released 1 May 2026.